Student Sleep
Q.
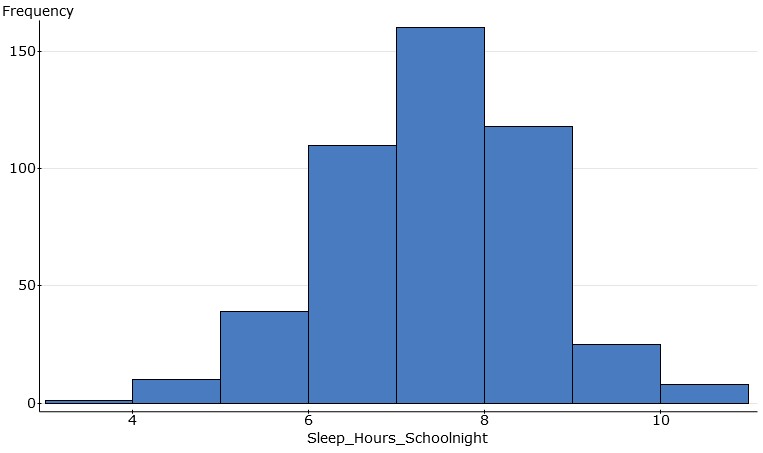
The histogram below shows the distribution of the number of hours a random sample of 471 high school students in Georgia slept on the previous school night. Describe as completely as possible the distribution shown in the histogram, being sure to explain what the graph tells you about the number of hours high school students in Georgia sleep on school nights.
